The Science of Learning: 99 Studies That Every Teacher Needs to Know, 2nd Edition
Authors: Edward Watson and Bradley Busch
ISBN-13: 978-0367620790
APA Style Citation
Busch, B, and Watson, E. (2020). The Science of Learning: 99 Studies That Every Teacher Needs to Know (2nd ed.). Routledge.
Buy This Book
https://www.amazon.com/Science-Learning-Studies-Every-Teacher/dp/0367620790
Authors: Edward Watson and Bradley Busch
ISBN-13: 978-0367620790
APA Style Citation
Busch, B, and Watson, E. (2020). The Science of Learning: 99 Studies That Every Teacher Needs to Know (2nd ed.). Routledge.
Buy This Book
https://www.amazon.com/Science-Learning-Studies-Every-Teacher/dp/0367620790
| activity_science_of_learning.pdf |
| key_activity_science_of_learning.pdf |
Book Description
The Science of Learning explores research in educational and cognitive psychology and how it can be applied to help students learn better. It points out that despite the vast amount of research in this area, teachers often need help finding and interpreting lengthy and complex academic papers.
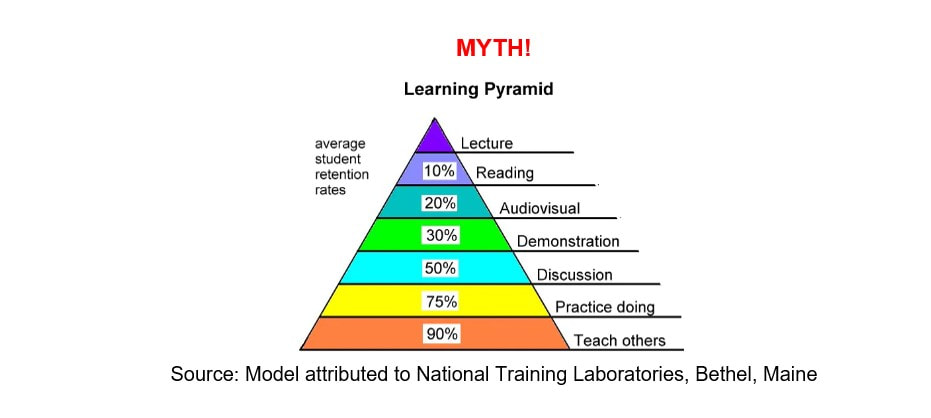
For example, the results of one study in the book looked like this in the journal:
The Science of Learning explores research in educational and cognitive psychology and how it can be applied to help students learn better. It points out that despite the vast amount of research in this area, teachers often need help finding and interpreting lengthy and complex academic papers.
For example, the results of one study in the book looked like this in the journal:

Authors Edward Watson and Bradley Busch aim to spark and inform discussions about the science of learning and its application in classrooms. They provide practical insights for teachers' professional development, including specific examples such as adjusting teaching methods based on research findings, implementing retrieval practices, and incorporating regular breaks for improved focus and energy.
The book's layout simplifies complex research, making it accessible to educators and students. Understanding the research is essential, but implementing it is another challenge. The authors take a study and delve deeper into practical implementation methods and potential obstacles and challenges teachers may encounter.
The book presents essential research findings from various fields relevant to education, each structured like an episode of the TV show "Friends," such as "The one about how much we forget" or "The one about cognitive load." Each study includes detailed sections comprising a short description of the study, main findings, related research, and classroom implications. Many studies also feature quantitative and qualitative data displayed in graphs, charts, and images to enhance understanding.
Additionally, the book offers separate sections titled "Tips for improving memory," "Tips for improving mindset, motivation, and resilience," "Tips for improving self-regulation and metacognition," "Tips for students," "Tips for teachers' attitudes, expectations, and behaviors," "Tips for parents," and "Tips for overcoming thinking biases." These sections provide practical strategies based on the research findings to support educators, students, and parents in various aspects of teaching and learning.
Furthermore, the book includes a section titled "When the Science of Learning Meets the Art of Teaching," which delves into key topics such as retrieval practice, creating a growth culture, developing independent learners, managing mobile phones, mastering classroom management, fostering a home environment that aids learning, and enhancing self-awareness through self-reflection.
Finally, the book concludes with a complete reference list of all studies cited, providing readers access to further information and resources. Through its engaging presentation and actionable insights, "The Science of Learning" will help students review and apply research in psychological science. For teachers of AP Psychology, this book is an excellent source to help students develop science practices related to research methods, statistics, and data interpretation.
Other Related Resources
Author’s website
https://www.innerdrive.co.uk/about-us/who-we-are/
InnerDrive Blog
https://blog.innerdrive.co.uk/
InnerDrive Education Resources
https://www.innerdrive.co.uk/education-resources/
Video describing the author’s five favorite educational studies
https://www.youtube.com/watch?v=5SDGPmWciAE
Psychological Figures and Concepts
Academic buoyancy
Cognitive load
Dunning-Kruger effect
Effort contagion
Forgetting curve
Growth mindset
IKEA effect
Impostor syndrome
Interleaving
Köhler effect
Metacognition
Mindset
Motivation
Planning fallacy
Primacy effect
Proactive interference
Pygmalion in the classroom
Resilience
Retrieval practice
Retroactive interference
Schema theory
Self-fulfilling prophecy
Self-regulated learning
Social rejection
Spacing effect
Spotlight effect
Talent bias
Transfer of learning
Working memory


 RSS Feed