BOOKS FOR PSYCHOLOGY CLASS
  • Books for Psychology Class
  • Blog
  • Contact/Submissions
  • Other Psychology Websites
  • For Students

you may also like: Taste in an Age of Endless Choice

1/28/2019

0 Comments

 
you_may_also_like_activity_.docx
File Size: 58 kb
File Type: docx
Download File

Picture
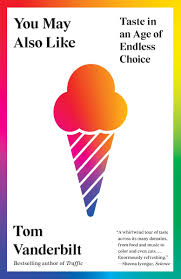
​You May Also Like: Taste in an Age of Endless Choice
Author:  Tom Vanderbilt
ISBN:  978-0-307-93859-5
 
APA Style Citation
Vanderbilt, T. (2016).  You may also like:  Taste in an age of endless choice. New York, NY: Vintage Books.
 
Buy This Book here:
https://www.amazon.com/You-May-Also-Like-Endless/dp/0307948595


​
Book Description
Tom Vanderbilt explores why we like what we like. This seems fairly straight forward, we have an experience, we determine how we feel about that experience and then assess that experience.  We tend to believe that our preference leads us to a choice, but Vanderbilt sites economists who argue that this can also work in reverse and that our choices can lead to preferences.  For example, once we have paid $200 for concert tickets, we are more likely to report liking that concert than if we saw the same concert for free.  Effort justification is one component of liking, it occurs when the more effort we put into something is indicative of liking that experience more.  Vanderbilt explores many more of the components that make up liking and reveals that we often fool ourselves into believing that we have total control over what we like and that we are not influenced by outside sources.
 
Preference for colors may be one of the earliest likes we verbalize, however, it may be the association of colors that feed our preferences rather than the color itself.  Young girls may describe a preference for pink not because of some natural inclination but rather because the marketing of toys that they enjoy are often pink.  Pinkaliciousis a cartoon character intended to appeal to young girls, liking the character may also increase liking of the color. We may demonstrate a preference for our own school colors without realizing that we are demonstrating a preference for colors that have brought some positive outcome or feeling in the past. 
 
Our preferences for taste may in part have a biological basis, we are quicker to articulate what we do not like rather than what we like. Evolutionary psychologists suggest that we have a natural inclination to dislike bitter tastes.  Try to recall your first taste of coffee, you likely cut the bitterness with milk or sugar, but over time you may have come to enjoy and even crave this taste, thus bypassing your natural preferences.  The taste for sweet conversely is prewired and desirable as highly caloric foods may have served the function of providing calories and energy.  Provide a young child with a taste of bitter chocolate or sweet candy and the preference will be easily displayed.  Humans naturally are “neophobic” or hesitant to try new foods, this may be because we do not know what new foods contain and are not certain that they are safe. Think of the first time you have tried a new food, chances are you did not immediately fall in love.  Vanderbilt argues that the mere exposure effect has a dramatic influence on what we like or do not like.  We tend not to like what is new or different, this applies to tastes, or music or fashion rather, the more we are exposed to something, the more we tend to like it.  Once we try that new food, song, or style over and over again, it becomes familiar which often leads to liking.  However, this liking is not completely objective, we now have an expectation of what a certain food will taste like or what a certain genre of music should sound like and we compare it to past experiences.  
 
This top-down processing allows us to place our experiences into context by comparing them to similar experiences in the past.  If you loved classic 1960s rock music and then heard the punk music of the 1970s you may have initially been horrified, but after listening over and over again you may find you prefer this to classic rock.  Just seeing a new food or knowing your favorite band has a new album creates an expectation before the sensory experiences even begins.  While we attribute our preference to bottom-up processing, our preferences are driven by our expectations as much as by our sensory receptors.  We also like choice, just by having items on a menu or a playlist to select from makes us enjoy our choice more that if this is out of our control.  If you go to The Cheesecake Factoryand are presented with a menu that spans seven pages, you may still choose the same item or few items each time you dine, but the illusion of choice increases your liking for what you have selected.  
 
Marketers make a living from studying people`s preferences and may know what we like, or dislike better than we do.  We are not always honest in reporting what we like because we want to portray ourselves in a positive light.  Organizations like Netflix know this, so you might report that you love watching historical documentaries, but the recommendation Netflix is making for you is a silly romantic comedy.  What people say they like and what they actually watch are not the same.  Todd Yellin, Netflix vice president for product innovation says, “You might giveHotel Rwandafive stars and two stars to Captain America, but you are much more likely to watch Captain America.”  We also don`t necessarily show consistency over what we like, as people rate the same movie differently after multiple viewings.  Context, mood, setting, and who you watch a movie with have a tremendous impact on your preference for that film, food, person, artwork, etc.  
 
Experts no longer have the same sway as before in terms of creating our sense of liking.  With social media sites anyone can become an expert and the opinions of lay people and experts vary greatly.  Those who rate hotels or restaurants, tend to come from a bimodal population, they either had a great experience or a horrible experience and can easily share this online.  When we see positive reviews, we are more likely to follow suit or adjust our opinion in a positive direction.  When the first comments are negative, the next comments seem to also follow suit. However, this can backfire; books that have received literary awards actually are rated lower after they receive the rewards.  Presumably this occurs because sales increase after the award causing people who would not normally purchase the book to buy a book that might not suit their particular preferences.  It may also set up an unrealistic expectation that the book will be life changing and it may not live up to the hype.  Too many reviews online are like too many choices, even if a book or a hotel has 4,000 reviews you cannot reasonably take in and assess all of that information, so you will read a few reviews and make a decision from there. 
 
Everyone wants to feel that we are unique in our likes or dislikes, so we reject the idea that we are conforming to a norm, we feel silly when we wear the same shorts as someone else to work or wear the same prom dress, which we think perfectly suits our personality.  Solomon Asch clearly demonstrated our tendency to conform to others in his historic line study, but just as the participants in his study stated that they believed they provided the correct responses, we also believe that we set our own trends and do not give into the pressure of conformity.  We conform to the preferences of our friends and fashion and we tend to like those who share our preferences.  
 
Each of these factors contribute to the vast lists of likes and dislikes we experience each day. Knowing these factors can allow us to realize that preferences are more subjective and less personal than we might like to believe.  Knowing how are preferences are shaped can help marketers or advertisers, or those social media influencers shape our likes and dislikes.  Vanderbilt`s research demonstrates that, “we really can account for taste.” 


​Other Related Resources
Video description of book in discussion with Tom Vanderbilt
https://www.youtube.com/watch?v=B9rRDhE409Q
 
Tom Vanderbilt Website Featuring You May Also Like
http://tomvanderbilt.com/books/you-may-also-like/
 
Talks at Google:  Interview with Tom Vanderbilt
https://talksat.withgoogle.com/talk/you-may-also-like
 
Social Psych online:  The Mere Exposure Effect
http://socialpsychonline.com/2016/03/the-mere-exposure-effect/
 
Video on Mere Exposure Effect from Easy A
https://www.youtube.com/watch?v=x9MvUdR6j3w
 
The Guardian:  Advertising and Controlling our thoughts
https://www.theguardian.com/commentisfree/2018/dec/31/advertising-academia-controlling-thoughts-universities
 
 
Psychological Figures and Concepts
Solomon Asch
John Dewey
Hans Eysenck
Gustav Fechner
Eric Kandel
John Locke
Konrad Lorenz
Stanley Milgram
Amos Tversky
Robert Zajonc
 
Alzheimer`s Disease
Assimilation
Amygdala
Assimilation
Bimodal Distribution
Bottom-Up Processing
Cognitive Dissonance
Critical Period
Dual Processing
Effort Justification
Factor Analysis
False Consensus Effect
Foveal Vision
Fronto-temporal Dementia
Gestalt
Habituation
Heuristics
Idealized Self
Inter-Rater Reliability
Mere Exposure Effect
Modeling
Necker Cube
Neuropsychology
Pavlovian Conditioning
Priming
Prototype
Psychophysics
Regression to the Mean
Repressed Memories
Snowball Effect
Social Influence Bias
Social Learning
Top-Down Processing
 
0 Comments

Factfulness:  Ten Reasons We`re Wrong About the World-and Why Things Are Better Than You Think

1/7/2019

0 Comments

 
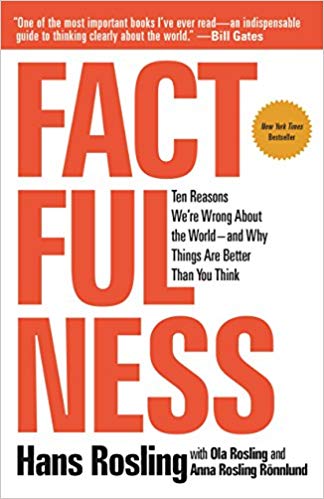
​Factfulness:  Ten Reasons We`re Wrong About the World-and Why Things Are Better Than You Think
Author:  Hans Rosling
ISBN:  978-147-363-7467
 
APA Style Citation  
Rosling, H. (2018).  Factfulness: ten reasons we`re wrong about the world-and why things are better than you think.  Flatiron books.
 
Buy This Book  
https://www.amazon.com/Factfulness-Reasons-Wrong-Things-Better/dp/1473637465. 
Picture
factfulness_quiz.docx
File Size: 20 kb
File Type: docx
Download File

key_factfulness_quiz_.docx
File Size: 23 kb
File Type: docx
Download File

​Book Description  
Factfulnessis Hans Rosling’s last effort to dissolve misconceptions about the current state of the world using data to demonstrate how confirmation bias, expectations, media, and ethnocentrism can blind us to the realities of the world in which we live. Before you continue reading, move to the activity for Factfulness and take the 12-question quiz.  Once you are done and have checked your results, come back and read more about the results of others who took the quiz and how Rosling uses data to demonstrate how conditions around the world continue to improve and how we often fool ourselves into thinking that things are worse than they actually are.
 
In 2017, Rosling asked nearly 12,000 people in 14 countries to answer the questions in the quiz.  He also asked chimps to answer the questions, and the chimps chose correctly 1/3rd of the time earning an average of 4 correct which is what we would expect from blind guessing.  College-educated adult humans from all over the globe faired far worse.  People on average scored 2 of the 12 questions correct. Not a single person got all of the questions correct, one person in Sweden earned 11 of the 12 correct, and 15% of respondents did not get a single question correct.  The educational level, age career, or political affiliation of the audience did not seem to matter.  Even the experts at the World Economic Forum in Davos, Switzerland did worse than the chimps.  
 
The reality is that the world has been steadily improving and while this improvement still needs to continue, we are inundated with images of poverty, disease and other sensationalist stories which often focus on the negative.  Much of this recent change for the better has been happening in Asia and Africa.  Those in Europe and the United States often do not see those changes and make negative assumptions about other parts of the world about which they have little data.  Rosling wants to help people understand these changes to better understand the current state of the world.  Students of psychology are often hesitant to learn about research and statistics, however, one of the most important lessons students of science can learn is that they should let the data lead them to a conclusion, not their intuition. Researchers should look for reasons to reject what they believe, rather than looking for support for preexisting presumptions.  Rosling describes data as therapy, which can confirm or in many cases disconfirm what we think we know.  When we have the facts, we can adjust our thinking to align with reality.
 
Rosling demonstrates how much the world has changed in his lifetime, and he describes how his grandmother spent many days doing laundry on a washboard.  His mother got a machine washer, and instead of doing laundry in the afternoon, she took Hans to the library.  Hans credits the washing machine to his interest and ability to spend time reading and pursuing academics.  These changes are not limited to wealthy countries which Rosling describes as level 4 countries(wealthy and healthy countries).  As an example, in Saudi Arabia in 1960, 242 babies out of every 1,000 died before their fifth birthday.  Today, that number is 35.  In Malaysia, the number was 93 in 1960 and is 14 today.  Europeans and Americans tend to look at the world using what Rosling refers to as the gap instinct, in their mind, they split the world into two groups of countries, rich or poor and assume that there are massive differences in the way people live in these countries.  
 
The reality is that most people today live in middle-income countries and have lives that have improved dramatically in the past few decades. Some of these changes include significantly increasing access to electricity, refrigeration, and mechanisms for cooking or heating food.  Rosling also explains the problem with using the terms “developing” and “developed” to describe countries around the world.  Eighty five percent of people living on the planet would fall into the bucket for the “developed” world.  Only 13 countries would fall in the “developing” world (representing 6% of the population), and all others would be in-between.  In the past 20 years, 29% of the world population lived in extreme poverty, today that number is 9%.  Billions of people have moved from levels 1 to levels 2 and 3, but often the media focuses on the worst stories distorting the reality of this improving situation. Rosling provides data for other phenomena that are improving, but from listening to the news, it would be difficult to identify this positive trend.  The death penalty, battle deaths, oil spills, legal slavery, child labor, smallpox and deaths from disasters have all been dramatically decreasing over the past 30 years. Rosling acknowledges that even one hungry child is a problem that needs to be addressed but we also need to understand that as a whole things are getting better.
 
Rosling describes an instance as a young doctor when he believed a Russian pilot with an expensive jumpsuit had just come into the emergency room and was bleeding profusely.  He was about to cut off the jumpsuit when the head nurse came in, and she explained that this was a Swedish pilot in shock which was why he could not speak properly and Rosling was standing on the ink cartridge from the life jacket he was wearing, making the entire floor red.  The jumpsuit Rosling was about the cut unnecessarily cut off, cost tens of thousands of dollars.  Rosling uses this story to explain how the fear instinct can make us jump to erroneous conclusions.  Critical thinking is almost always difficult, but it becomes even more so when we are afraid. The media feeds on this fear instinct by reporting on stories that will catch our attention even if these reports do not represent the trends in behavior.  Psychologists know this as the availability heuristic.  In 2016, 40 million commercial passenger flights landed safely at their destinations, we heard about the ten that did not.
 
Terrorism is a concern for those all over the world, despite media coverage, acts of terrorism are on the decline.  For those in level 4, from 2007-2016 a total of 1,439 people were killed by terrorists, during the ten years before that 4,358 people were killed. This includes the 9-11 attacks that killed 2,996 people.  In the past 20 years in the United States, an average of 159 people were killed by terrorists each year.  Alcohol, on the other hand, killed 69,000 people per year during the same time period. The chances that someone in the United States will be killed by a drunk driver is 50 times higher than being killed by a terrorist.  Frightening and dangerous are not necessarily the same.  
 
Rosling talks about the time he spent in a rural African district with an extraordinarily high childhood death rate.  He explained that as the only doctor in the district he could not spend hours saving the life of a child who came to the hospital because he could save far more lives by vaccinating hundreds of children in the same amount of time decrease the likelihood that they got sick.  While this may seem cruel, in reality, it is far more humane.  We hear about shark attacks and bear attacks that happened once in a rare while, but rarely hear about cases of domestic abuse which are far more fatal, in Sweden this occurs once every 30 days.  Rosling likens relying on the media to form your worldview to looking at a picture of his foot to get an idea of what he looks like.  It gives you part of the story, but it is certainly not complete.
 
While Hans uses data to bring people`s thinking in line with reality, he also emphasizes the human factor to his work.  His hypothesis and questions come from talking to others and in his openness for data to be interpreted differently.  At a conference on climate change, a European leader discussed the rapid growth in the use of fuels by India and China and indicated that they were going to have to find a way to slow down this use.  When he had finished speaking, the representative from India indicated that it was not only India and China that would need to change.  He argued that they were using more fuels because there were far more people living there and that usage should be considered on a per capita basis not country by country.  Those is the West had been using massive amounts of fuels for decades and are often unwilling to change any of their own behaviors.  These individuals had the same data but a very different interpretation of what that data meant and how to move forward. Rosling indicates that the world cannot be understood without numbers, but we cannot understand the world through numbers alone.  Rosling nearly finished Factfulnessbefore his death (his daughter and son-in-law also contributed much to the book and completed the project after Rosling`s death).  Rosling leaves a legacy of service to public health and the desire to improve the lives of people all over the world while simultaneously informing us about those factors that are improving and those that needed direct attention, for this we should be eternally thankful.
 
Other Related Resources
https://www.gapminder.org/tools/#$chart-type=bubbles
All data in the book (as well as much more) can be found on this website.  The data can be manipulated by country and is quite interactive.  There are handouts, posters, complete lesson plans and great information related to health, lifespan, disease prevention and much more.
 
Hans Rosling TED Talk:  How not to be ignorant about the world
https://www.ted.com/talks/hans_and_ola_rosling_how_not_to_be_ignorant_about_the_world
 
Hans Rosling TED Talk:  The best stats you`ve ever seen
https://www.ted.com/talks/hans_rosling_shows_the_best_stats_you_ve_ever_seen?language=en
 
Hans Rosling Obituary
https://www.theguardian.com/global-development/2017/feb/07/hans-rosling-obituary
 
Psychological Figures and Concepts
Availability heuristic
Descriptive statistics
Hypothesis testing
Inferential statistics
Muller-Lyer Illusion
Multi-factorial causation
 
0 Comments

    Categories

    All
    Biological Psychology
    Cognition/Learning
    Consciousness
    Development
    Disorders/Treatment
    Educational Psychology
    Health Psychology
    Motivation/Emotion
    Positive Psychology
    Research And Statistics
    Sensation/Perception
    Social Psychology/Personality
    Testing And Individual Differences

    Authors

    Laura Brandt, Nancy Fenton, and Jessica Flitter are AP Psychology instructors. Nancy Fenton teaches at  Adlai E. Stevenson High School in Lincolnshire, Illinois, Laura Brandt teaches at Libertyville High School in Libertyville Illinois and Jessica Flitter teachers at West Bend East High School in West Bend, Wisconsin.
    If you are interested in reviewing a book for the blog or have comments or questions, please e-mail us at either laurabrandt85@gmail.com or fenton598@gmail.com or jflitter1@gmail.com.

    RSS Feed

    Archives

    November 2023
    October 2023
    August 2023
    July 2023
    June 2023
    May 2023
    April 2023
    March 2023
    February 2023
    January 2023
    December 2022
    November 2022
    October 2022
    September 2022
    August 2022
    July 2022
    June 2022
    May 2022
    April 2022
    March 2022
    February 2022
    January 2022
    December 2021
    November 2021
    October 2021
    September 2021
    August 2021
    July 2021
    May 2021
    April 2021
    March 2021
    February 2021
    January 2021
    December 2020
    November 2020
    October 2020
    September 2020
    August 2020
    July 2020
    June 2020
    May 2020
    April 2020
    March 2020
    February 2020
    January 2020
    December 2019
    November 2019
    October 2019
    September 2019
    August 2019
    July 2019
    June 2019
    May 2019
    April 2019
    March 2019
    February 2019
    January 2019
    December 2018
    November 2018
    October 2018
    September 2018
    August 2018
    July 2018
    June 2018
    May 2018
    April 2018
    March 2018
    February 2018
    January 2018
    December 2017
    November 2017
    October 2017
    September 2017
    August 2017
    July 2017
    June 2017
    May 2017
    April 2017
    March 2017
    February 2017
    December 2016
    November 2016
    October 2016
    September 2016
    August 2016
    July 2016
    June 2016
    May 2016
    April 2016
    March 2016
    February 2016
    January 2016
    December 2015
    November 2015
    October 2015
    September 2015
    August 2015
    July 2015
    June 2015
    May 2015
    April 2015
    March 2015
    February 2015
    January 2015
    December 2014
    November 2014
    October 2014
    September 2014
    August 2014
    July 2014
    May 2014
    April 2014
    February 2014
    January 2014

Proudly powered by Weebly